
Environmental chamber application
A collaborative project with the Sustainable Buildings Research Centre (SBRC) at the University of Wollongong
Model house from the rear side
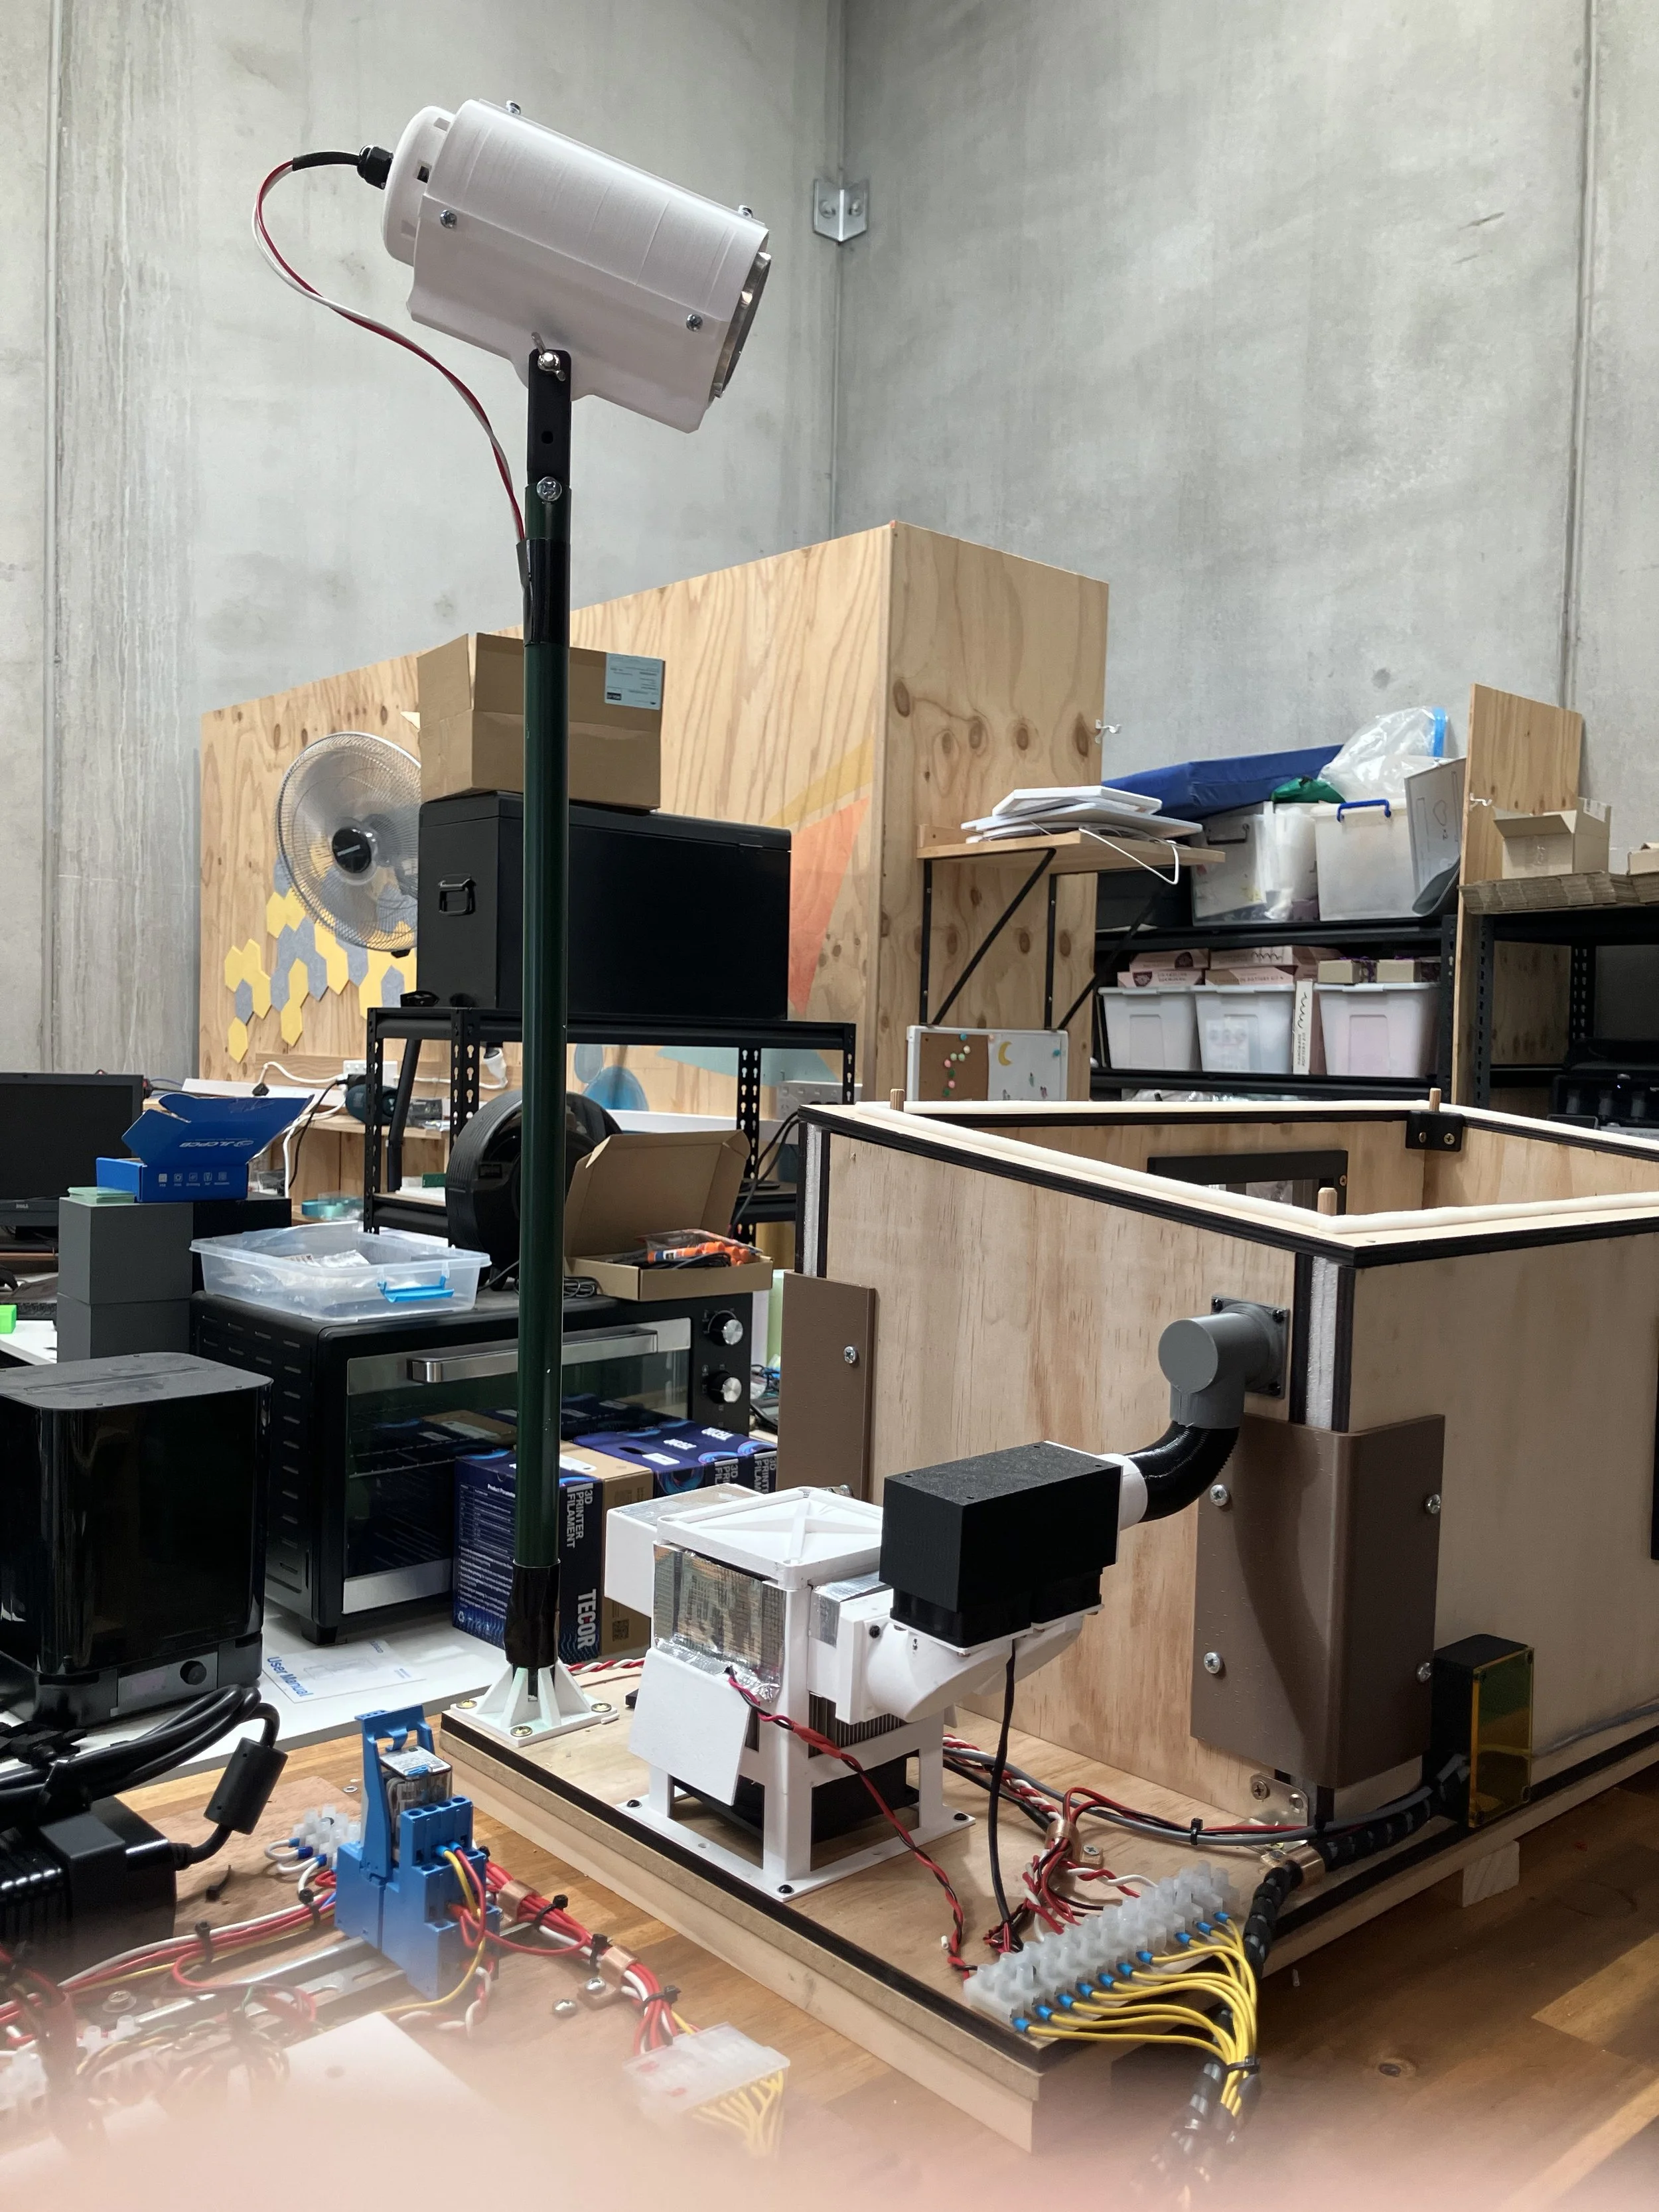
Model house from LHS showing sun on pole above house
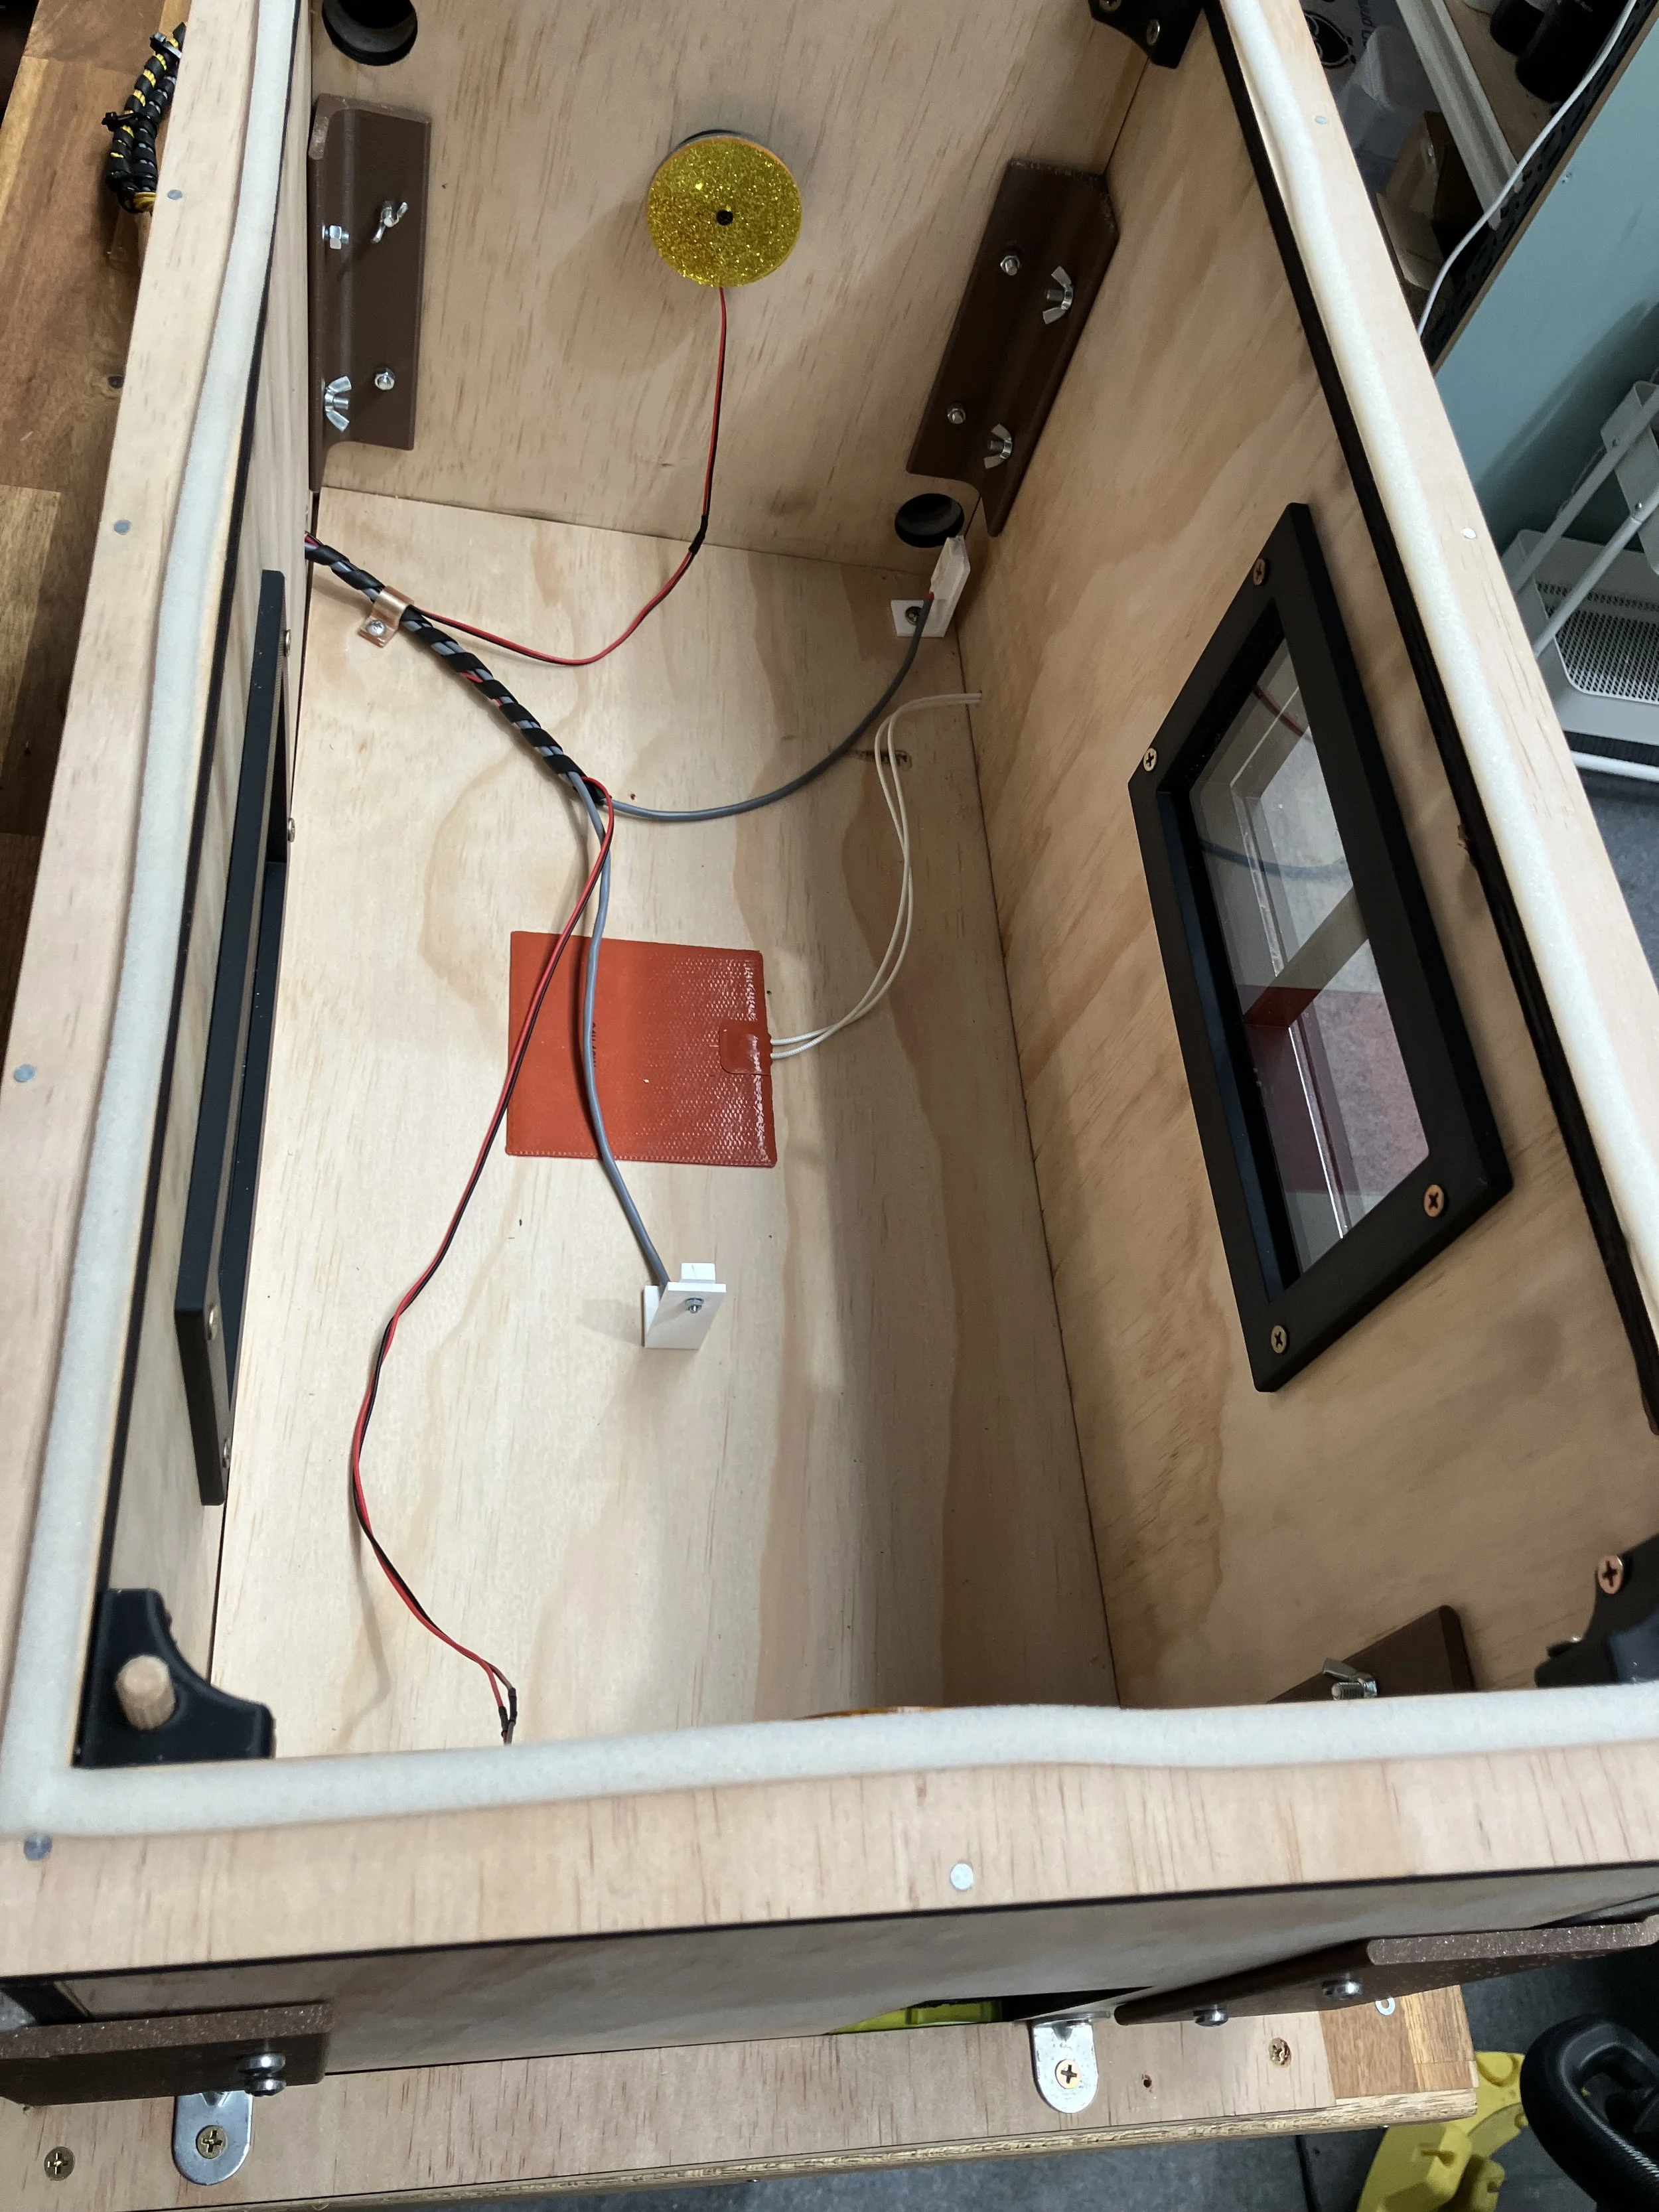
Top view of the model house without roof to show temperature sensors and floor heater and also lights
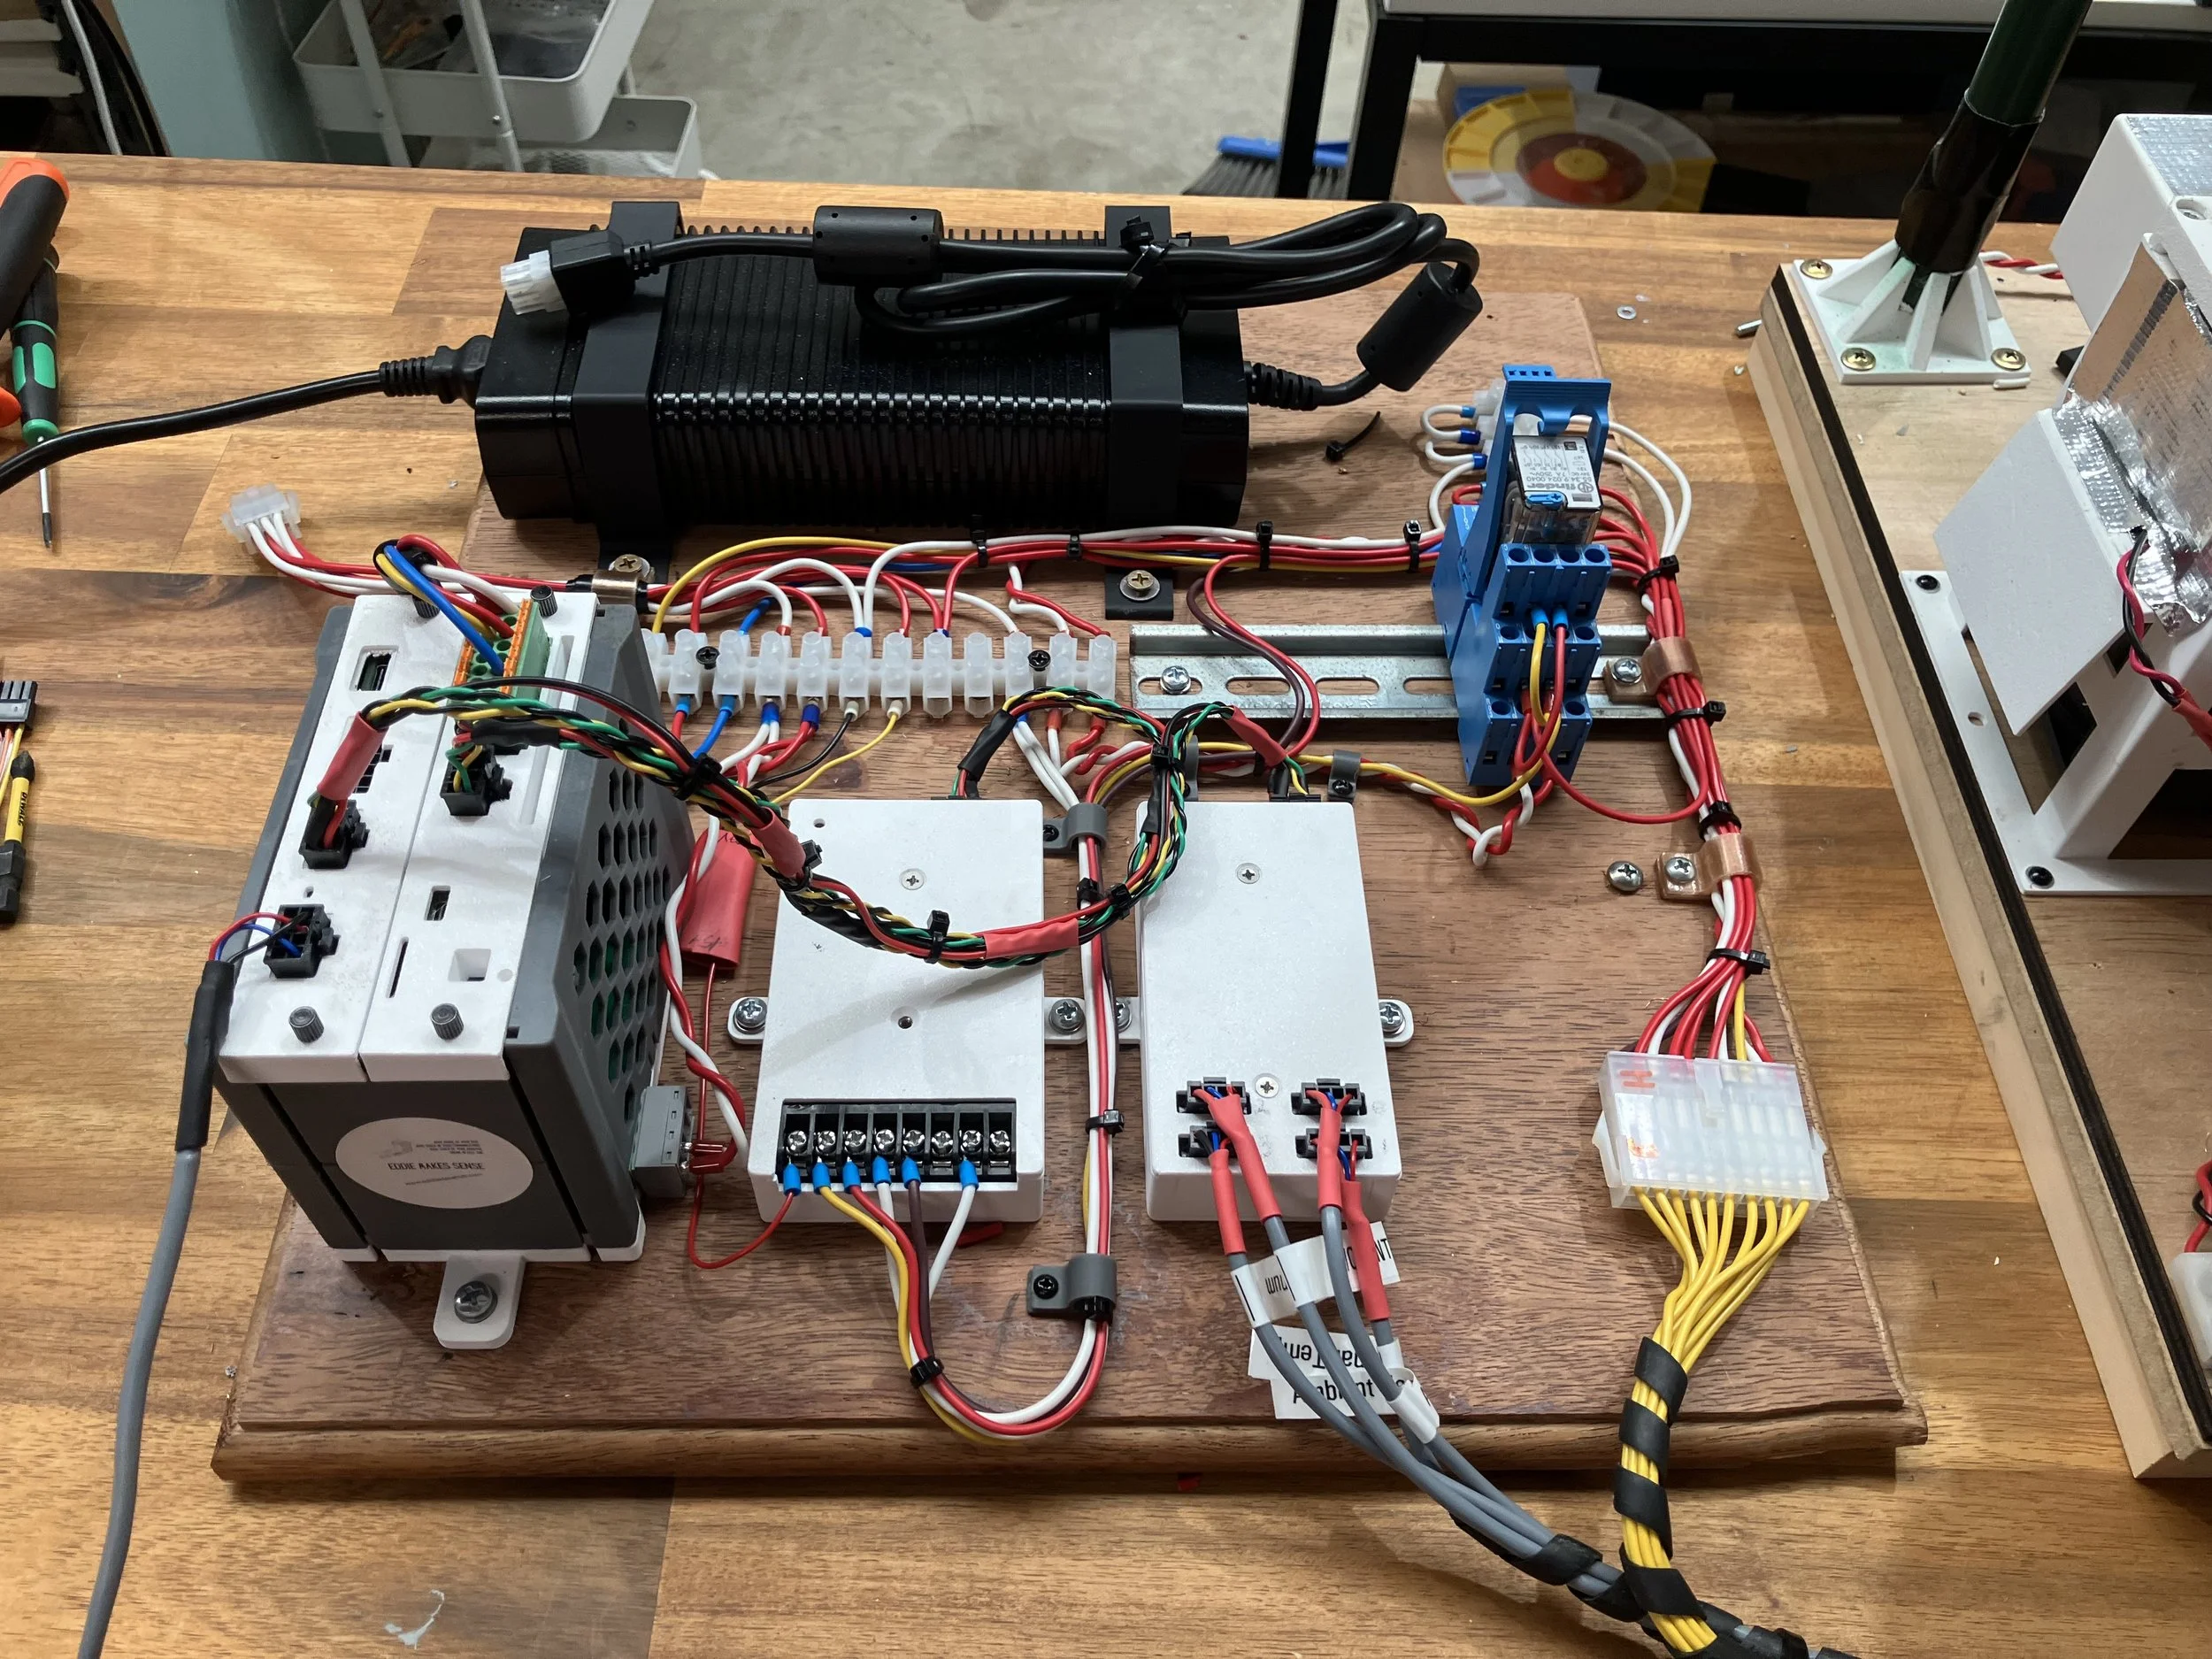
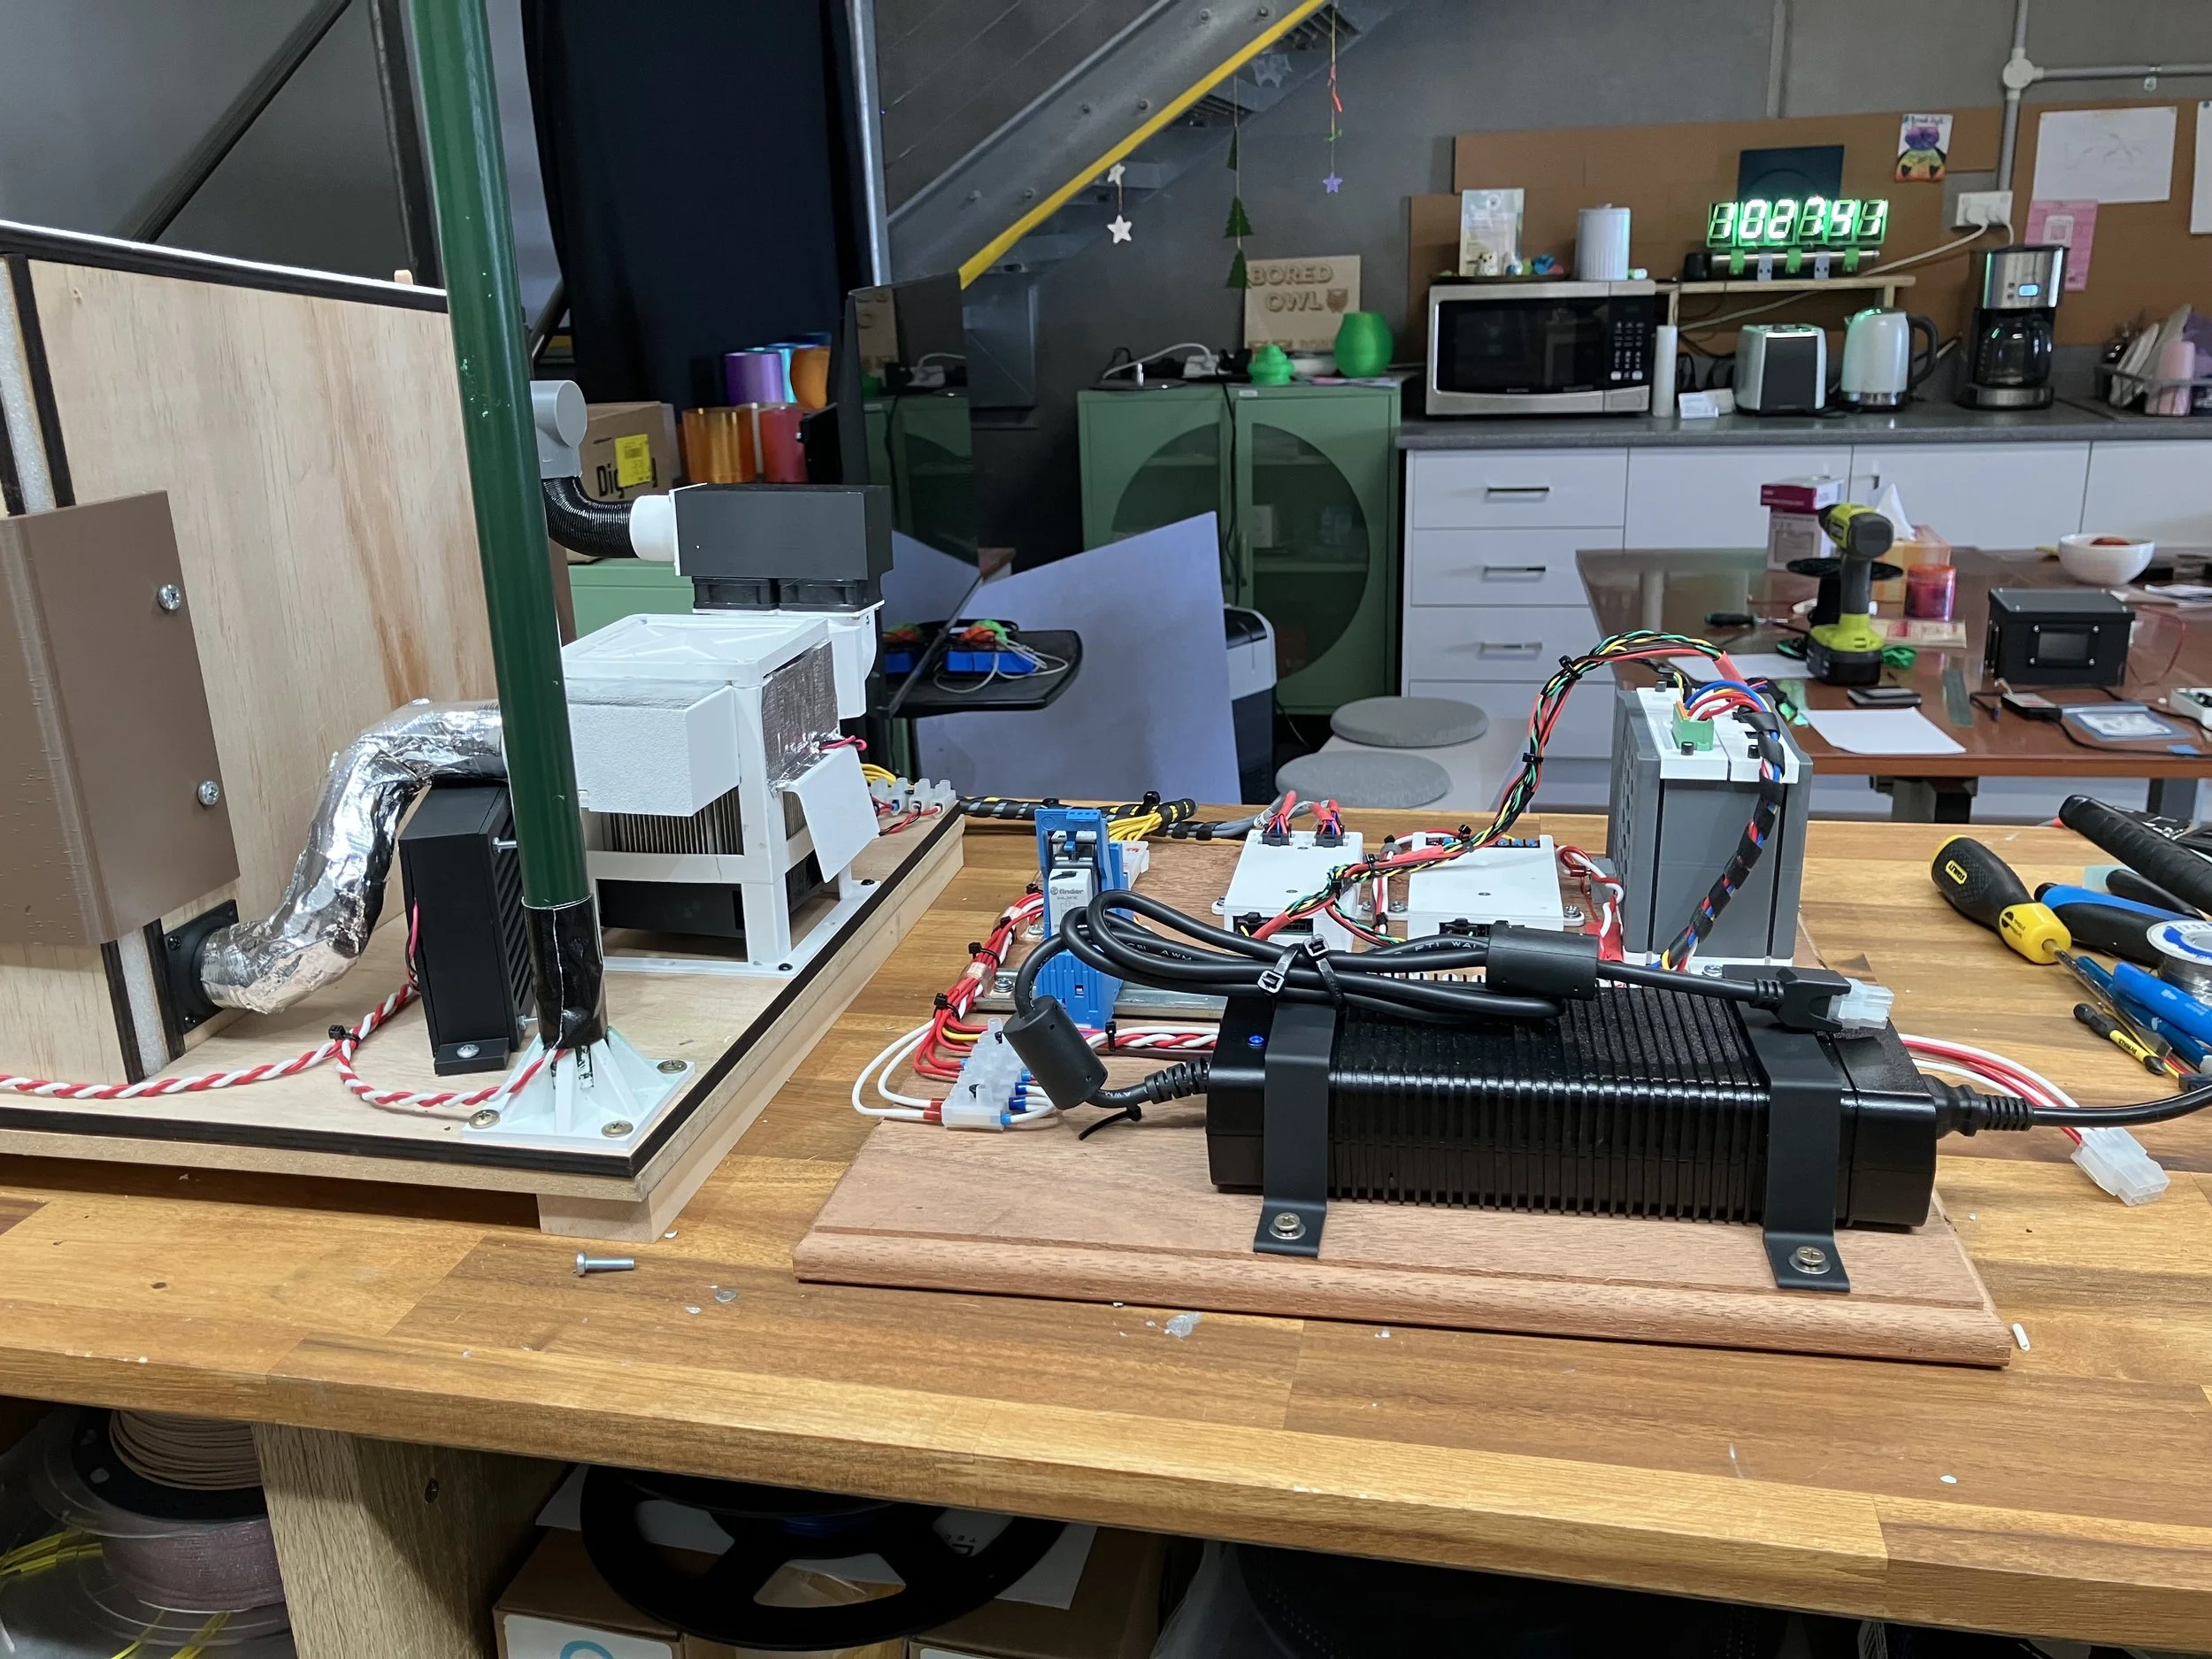
Power supply and Eddie Hub and two Eddie probes
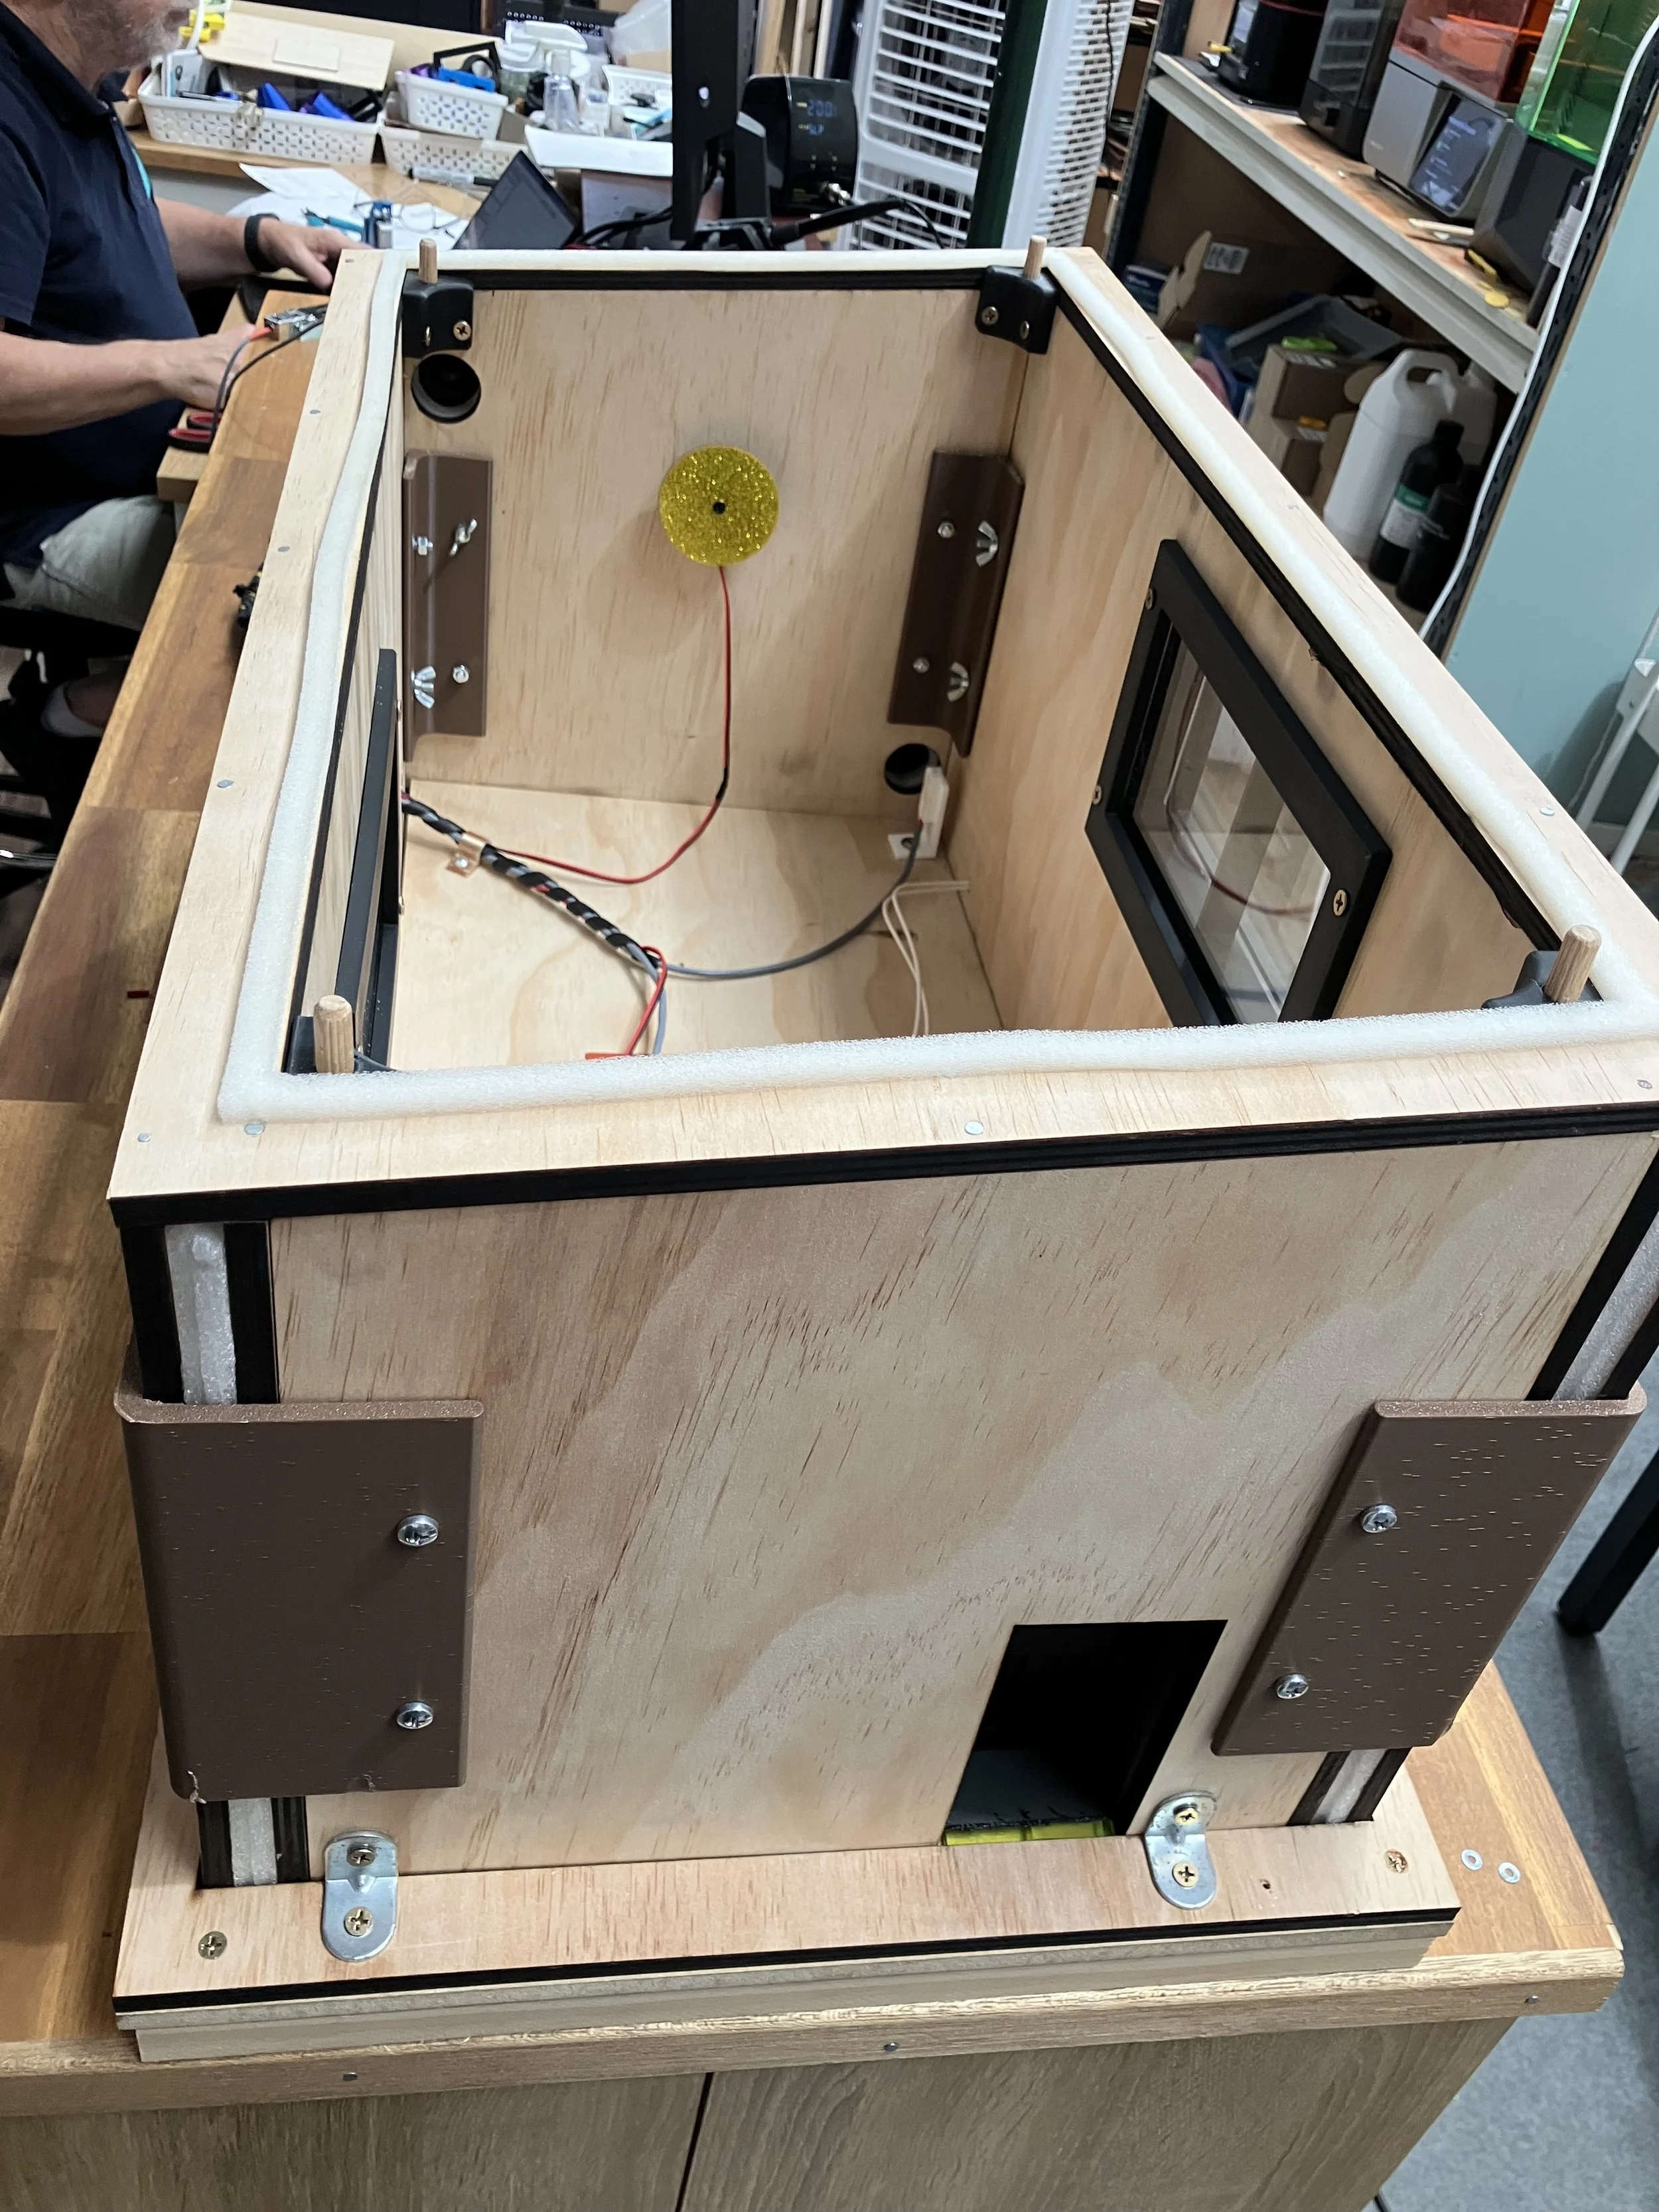
Front door of model house in black, door can open and close
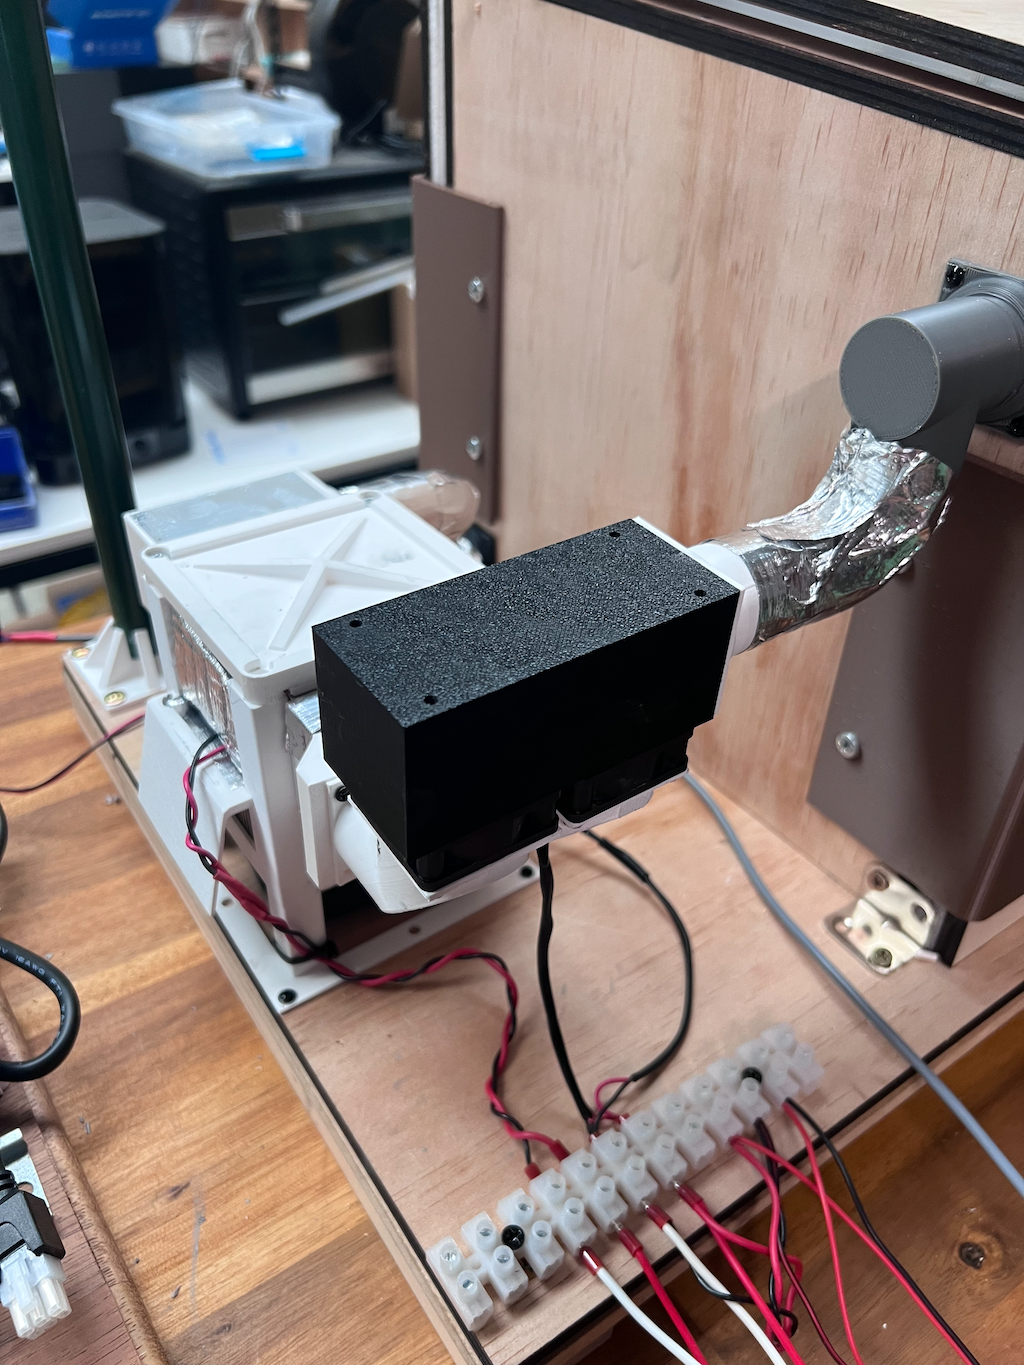
A view of the model air conditioner
Background:
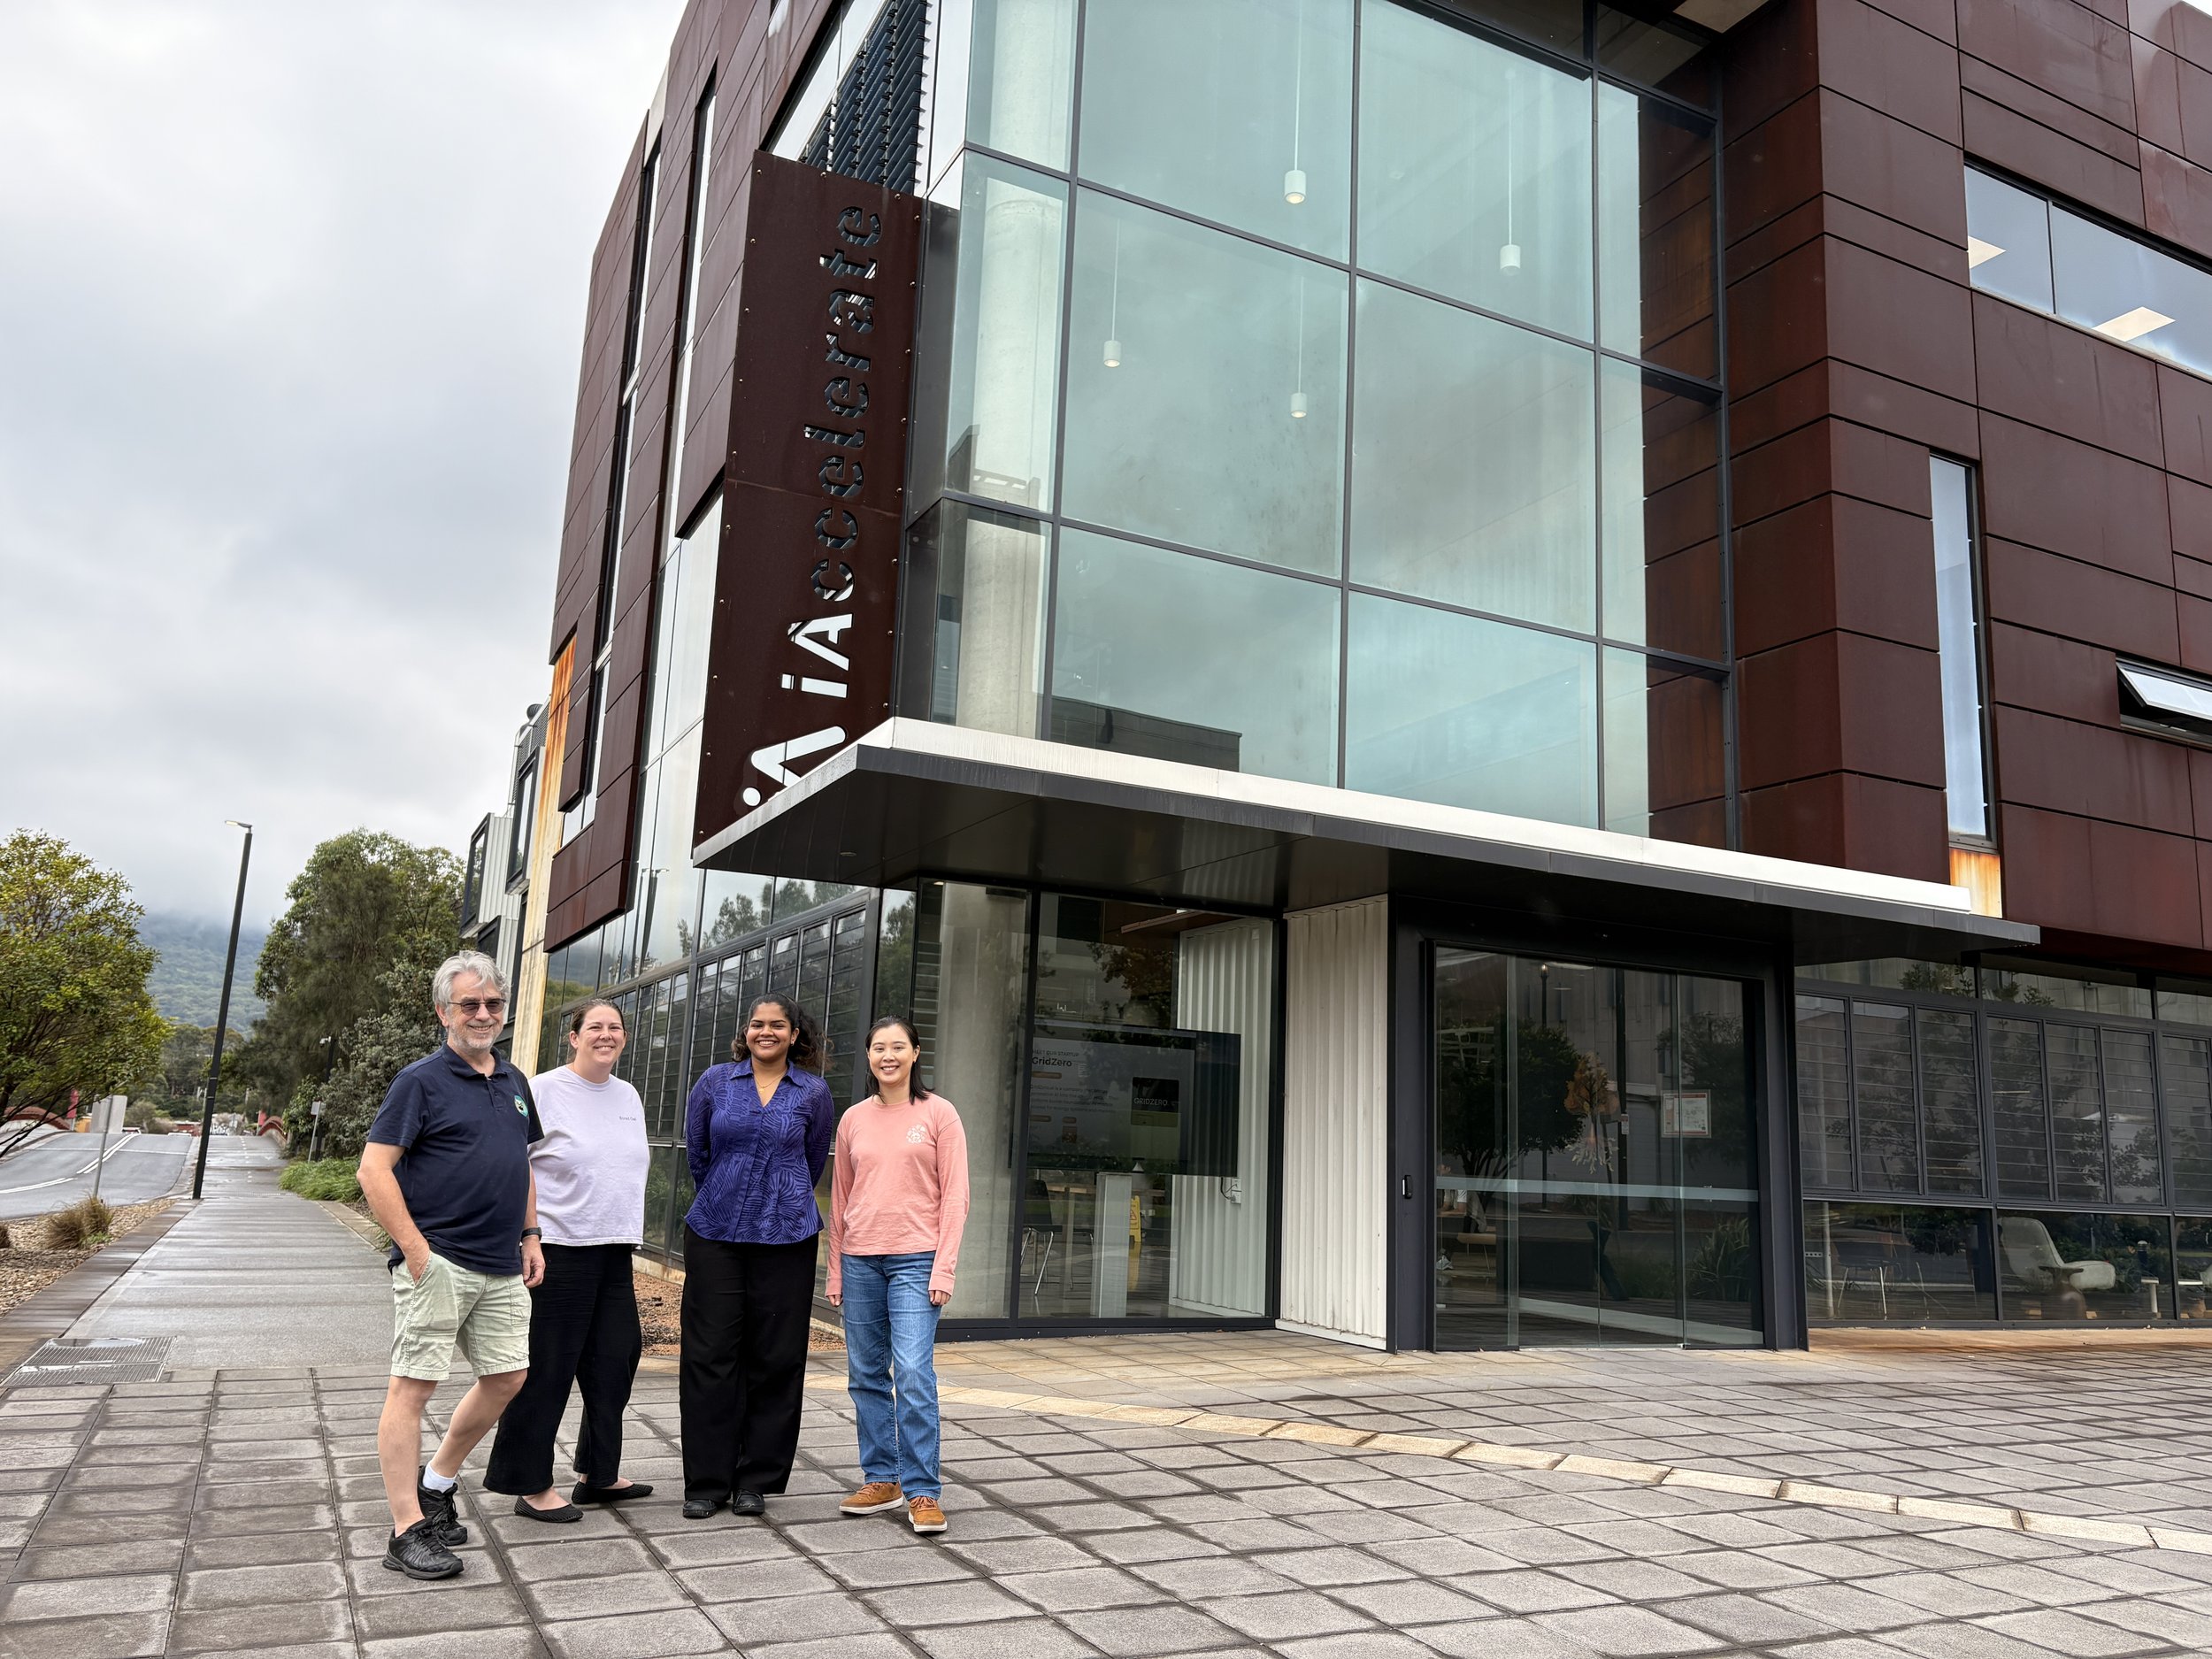
Project team: Jonathan Masters, Patricia Giang, Rakshitha Manohar and Dr Emily Yap
The Eddie Data Hub has been used for the first time and applied to an environmental chamber in a project collaboration with the Sustainable Buildings Research Centre (SBRC) at the University of Wollongong. The work was carried out as part of a Summer Student Project by third year Environmental Engineering student, Rakshitha Manohar, who was supervised by Dr Emily Yap from SBRC and Jonathan Masters from Bored Owl.
The aim of the project was to investigate how EDDIE could be used to control, monitor and log various electromechanical components (sensing and actuating) in an environmental chamber. As the project was within the field of sustainable buildings, the environmental chamber was a not-to-scale replica of a residential house. Future work could involve incorporating EDDIE to develop hardware-in-the-loop testing of building controls to measure internal heat gains, manage energy consumption and validate control strategies.
The model house was designed as a single room dwelling. Its walls were plywood-foam-plywood sandwich construction. The windows were fabricated as a single-glaze using clear acrylic with a 3D-printed frame, and likewise, the door was 3D-printed. The model house featured a mock air-conditioning unit to provide cooling and heating, and heat sources to represent internal heat gains from people and lighting, as well as a sun to represent external radiant heat.
The air-conditioning unit was simulated using a Peltier (or thermoelectric cooler) to provide cooled air into the house, or heat by reversing the polarity on the Peltier. A fan is used to push the cooled or heated air into the house and draw air to recirculate through the air conditioning unit. The Peltier device could be proportionally controlled with an Eddie DC power drive probe. A tiny Peltier based air conditioner was created to cool the air in the tiny house and it could also heat the house by reversing the polarity on the Peltier. Fans were used to blow air through the “air conditioner” and to draw air from the top of the house back into the “air conditioner”.
A small heating pad was included inside the house to mimic the heat which emanates from people or animals being in the house, and IT equipment and appliances, also known as internal heat gains. Like the Peltier device, the heating pad could be proportionally controlled (from 0-40W power) with another channel of the drive probe.
Two small LED ring lights with acrylic diffusers were fitted at each end of the house and could be turned on and off with a digital output on.
The mock “sun” positioned outside the house was created with a heating lamp and the heat emitted was cycled to mimic the sun’s heat strength on the building during the day.
Temperatures were measured using Eddie PEA sensors, located internally and externally to the house. An Eddie four channel analog probe receives the PEA sensor signals and converts them for the data hub to read.
The roof of the house can be lifted off and includes two layers. The first layer was of clear acrylic to allow observation of any probed action inside the house. The second layer closes the roof with plywood improve the roof insulation. Window insulating foam was used to seal the acrylic roof to the house frame to avoid air escaping.
This application used the first prototype Eddie (2-slot version) and first prototype Eddie probes type 4 (analog inputs for temperature) and type 5PWR (DC 24V/10 PWM controller). This project involved lots of learning for the student! For Bored Owl we came up with new ideas to incorporate into the design of Eddie’s hardware and software to make it more user-friendly.
Eddie components used in this application:
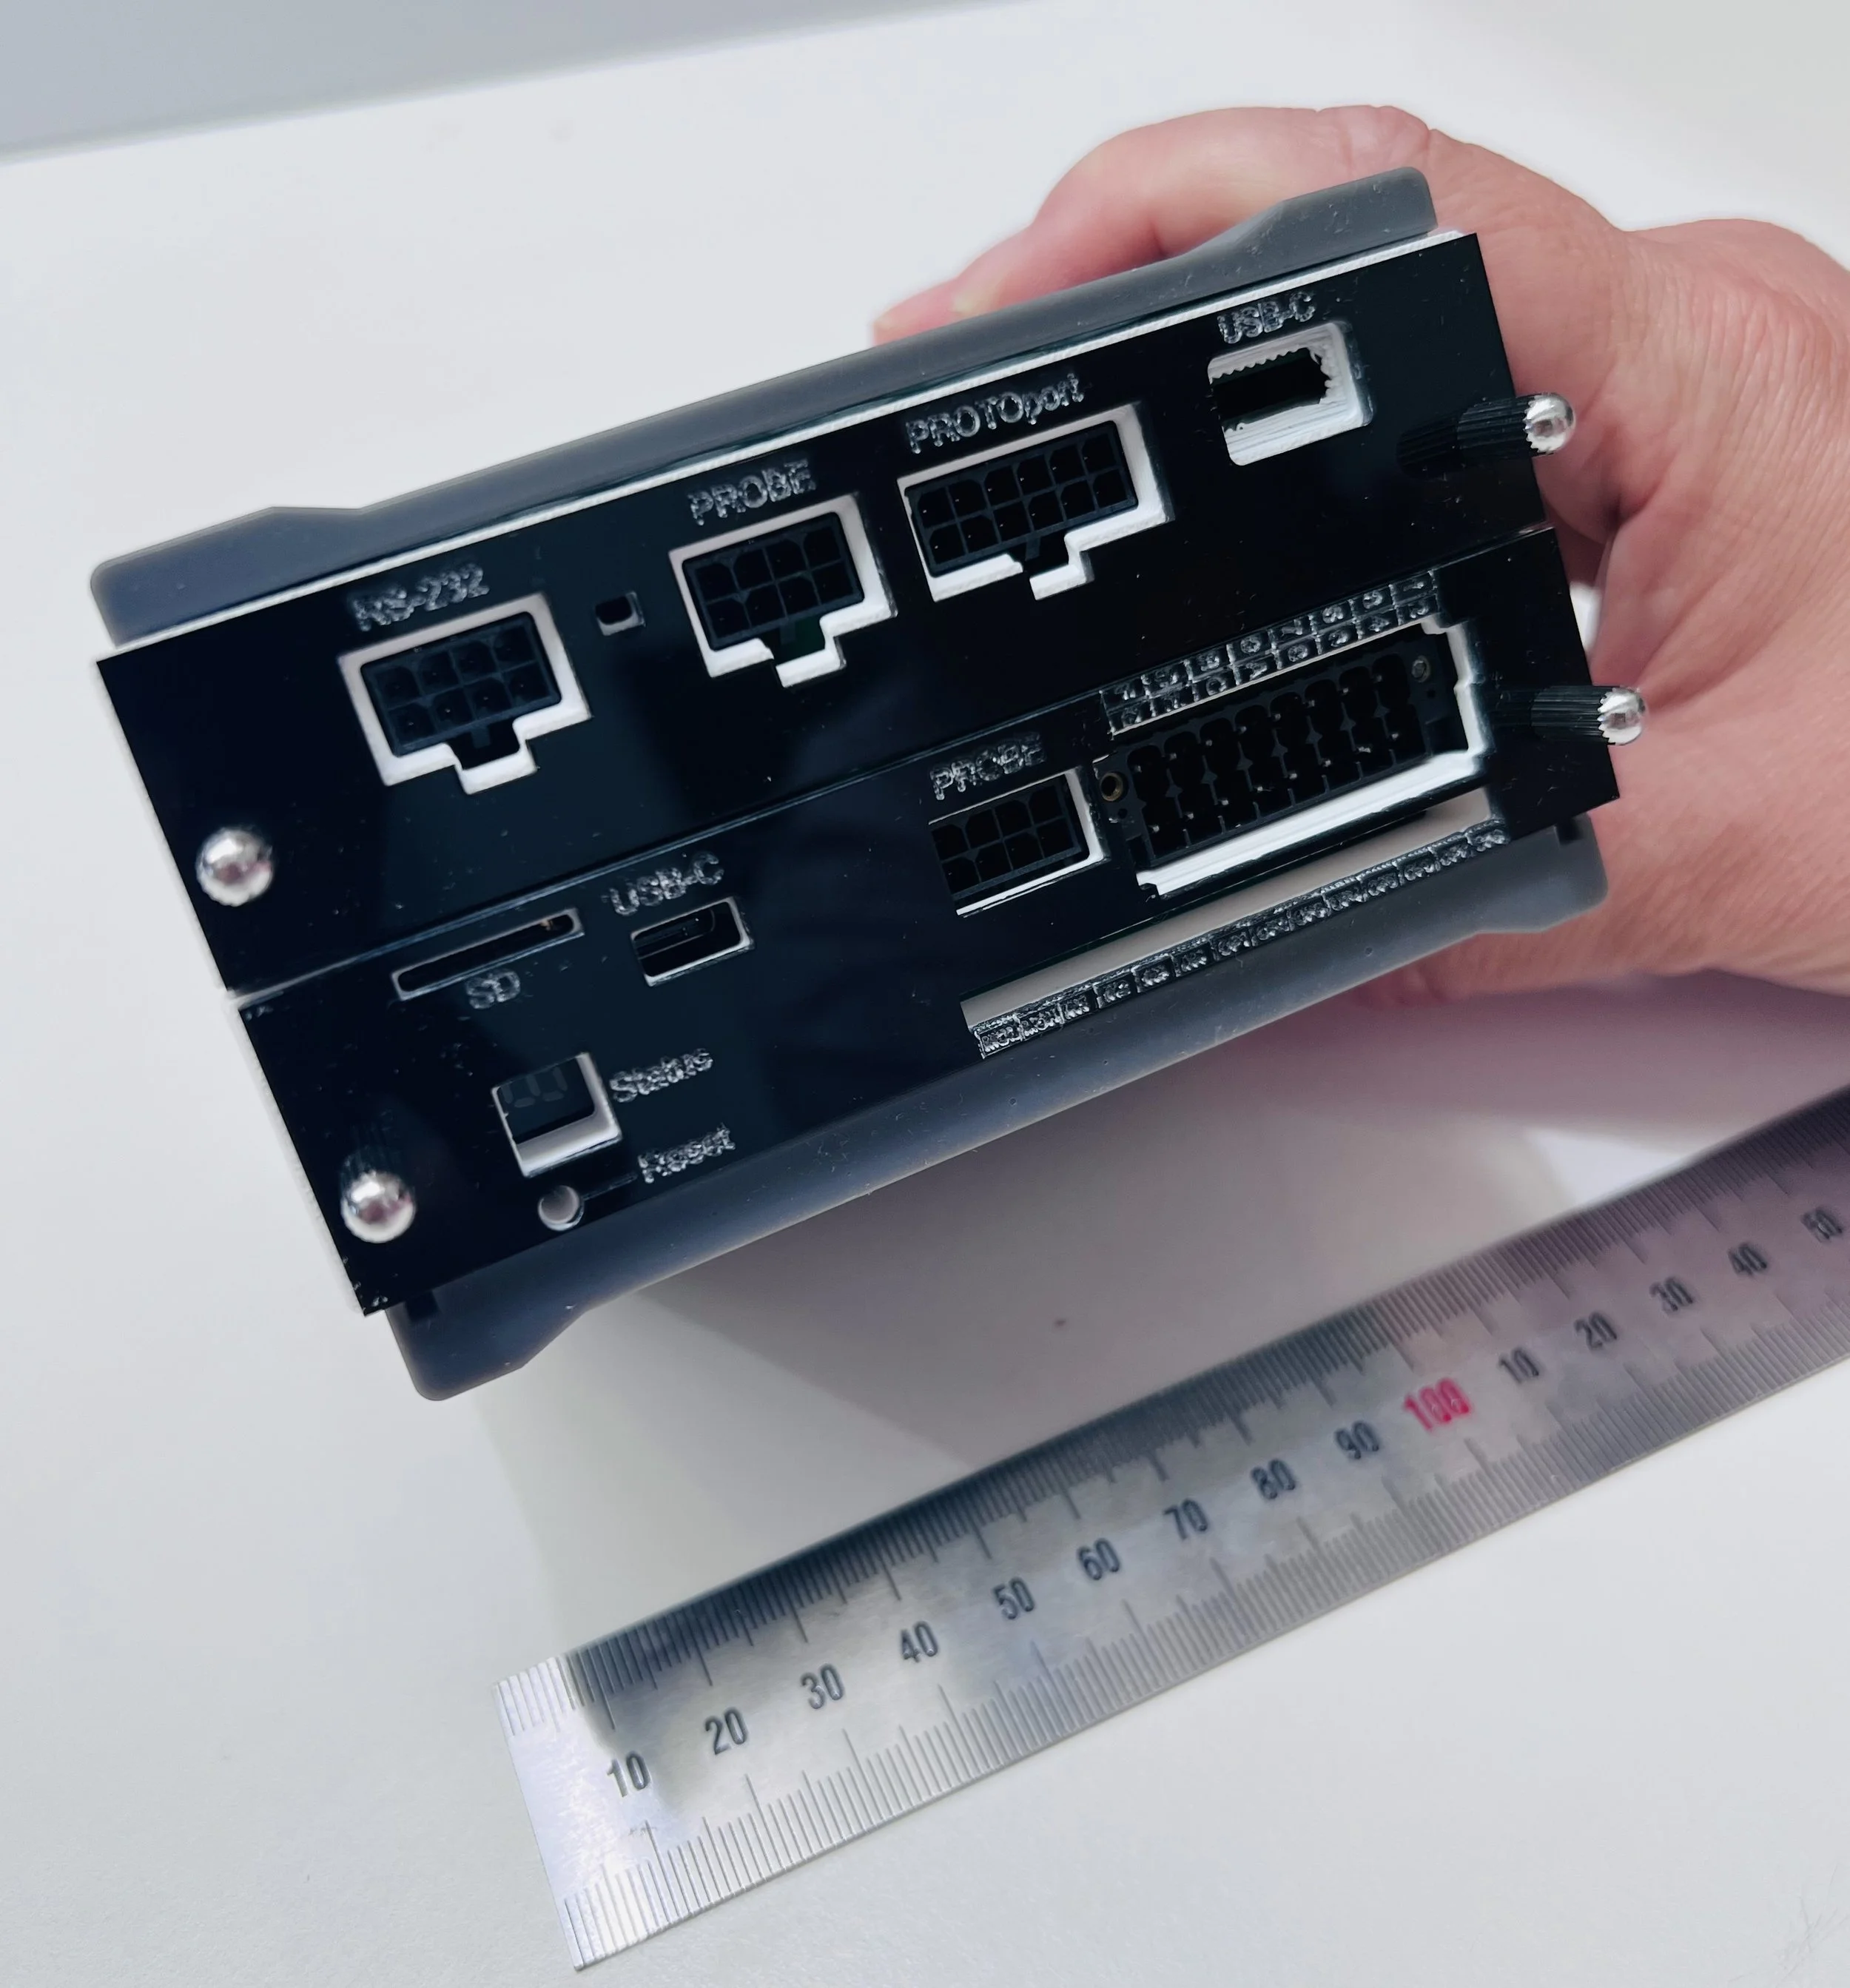
Eddie Data Hub - 2 slot version. Note ruler and hand for size comparison.
Eddie Data Hub - 2 slot version includes CPU51 card and serial card.
Eddie Temperature “PEA” modules.
These modules measure temperature over 5 .. 100C
Eddie probes:
Type 4: This probe can read and convert temperatures from the PEA modules.
Type 5PWR: This module has four outputs capable of pulse width modulating 24VDC power loads at up to 8A. Used for controlling Peltier, floor heating and sun lamp loads. Also used to turn the fans on and off.
KAT Software.
The full electrical schematic showing the interconnection of EDDIE parts can be obtained from https://github.com/boredowl-public/Eddie-K451/blob/main/SBRC_House_Schematic.pdf
Eddie features demonstrated in this application:
Features of the house controlled and monitored by Eddie:
Interior LED lights, on/off control
Air conditioning unit using Peltier module
0-100% power control over Peltier module
Control over duct fans to circulate air, and fan to remove heat from waste side and aux fan to remove hot cold air from area around air conditioning unit.
Floor heater - to simulate a heat load (i.e. occupants and appliances) inside the house. This has 0-100% proportional control.
Sun (radiant external heat) simulation. This has 0-100% proportional control.
Temperature measurement:
ambient temperature
internal house temperature
temperature in exit plenum of aircon unit
temperature in aircon vent into house
temperatures are signalled to the KAT terminal (n.b. this is the IDE we created for this application) and displayed on a dashboard. Signals are a unique part of the K4 system that allow components to message any other components and further out into host computers and wide area networks. Signals can be encapsulated in other messaging transports like HTTP, MQTT or 0MQ etc.
New Eddie features developed for this application:
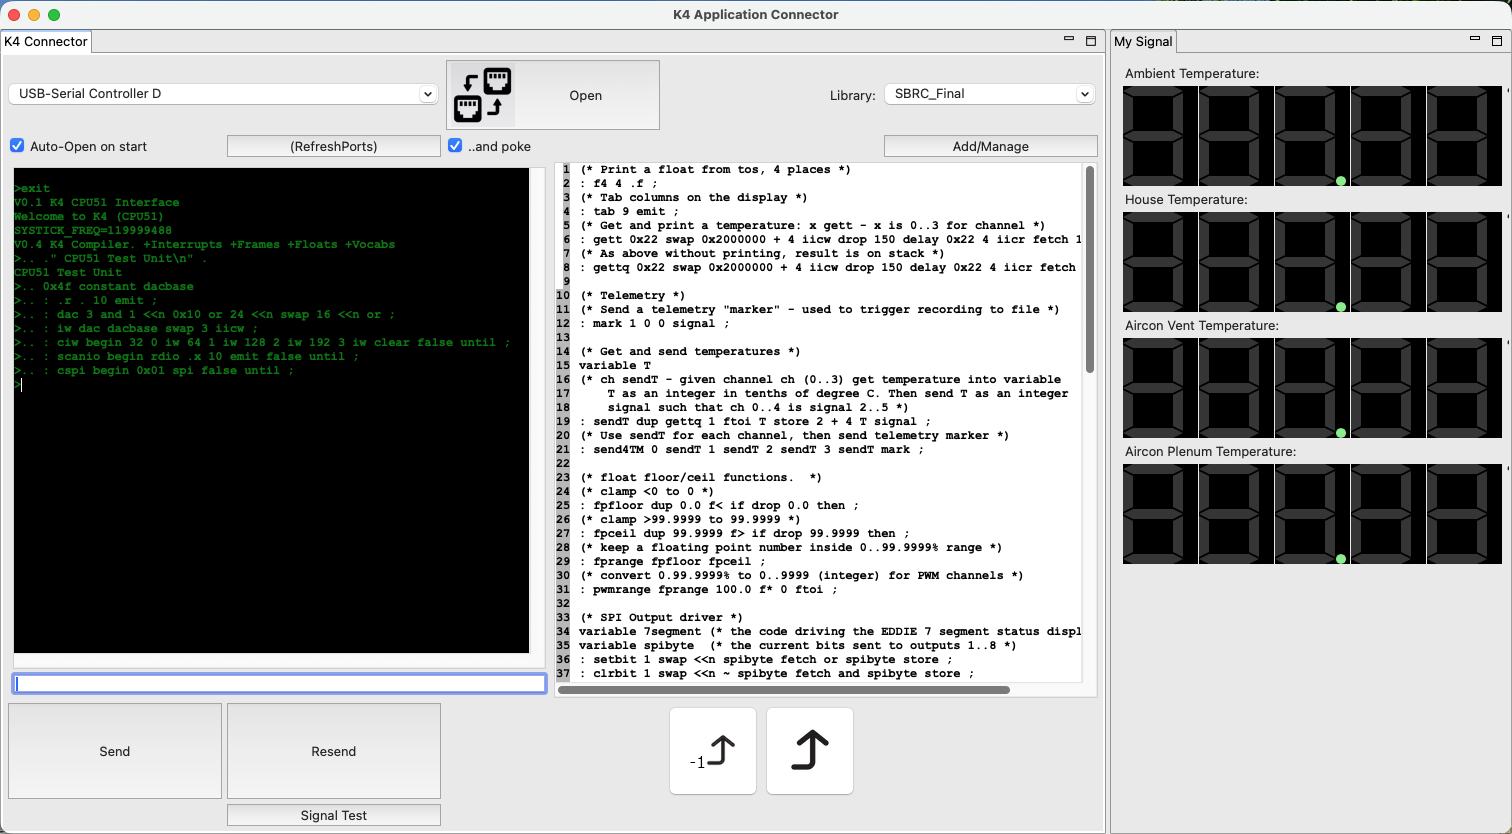
An IDE (Integrated Development Environment) for K4, which we call KAT!
During the construction and debugging of the project it was quickly determined that we had a problem working with the EDDIE unit. At this early stage, EDDIE only has an RS-232 console port, and we use a USB-Serial adapter and a terminal program such as “PuTTY” to reach the K4 system running on EDDIE.
The difficulty that arose was that if EDDIE crashed - bad “words” will do that, the program was lost. The only record might - if we were lucky - be on the screen. We needed a way to record what we typed and store it for posterity.
To solve this problem, “KAT” was born. A Java GUI program was developed quickly as a replacement for PuTTY with minimal effort. With a little extra work, some history was added to the terminal line. Now we could scroll backward though what we’d done and recall it - providing we didn’t restart KAT. We added the ability to transfer the history into another text panel we called th block buffer. We nearly have a code editor with this. Any line or group of lines in the block buffer could be sent to EDDIE at a click. If EDDIE crashed, we could re-boot it from the block buffer. Finally, we added the ability to keep blocks of code in a database library. The library is kept up to date as you type, and each block can be named. The basics of an IDE for K4 and EDDIE came to be as shown below.
On the left you can see commands and responses from EDDIE. In the middle, the stored program “SBRC_final” and on the right is a dashboard - more on that in a minute…
KAT is the basis for development, debugging and interaction with EDDIE systems and has come about from this project.
Adding a Dashboard in KAT
To make the behaviour of the model visible, we created a dashboard in the KAT terminal. Dashboards are built from a palette of widgets such as digital readouts, oscilloscope displays, meters, buttons and so-on. For this project, this dashboard was hard-coded as the definition of dashboards requires more software that is coming into development now. Looking at the screen-shot of the KAT system above, see the dashboard displaying the four temperatures in digital readouts. We should have liked to include the power settings and state of the model but time restrictions prevented more elaborate work.
Dashboards work by connecting a widget to a “signal”. The K4 system running on EDDIE can periodically send a signal object through the serial port to KAT. These objects are not visible to the user in the terminal window but are instead routed to the dashboard for it to handle. Each signal has a number and a data payload. Multiple widgets can if necessary respond to the same signal. In this work, we can only transport signals over the serial port connected to KAT. Ultimately signals can be transported by may mechanisms to remote servers or dashboards.
Implementing Data Storage in the KAT Dashboard
An “invisible” set of widgets exist in the dashboard system. These widgets are not displayed, but they still receive and handle signals. One such widget is called a “CSVRecorder”. This object receives signals and places the data payload into the relevant columns of a CSV record. When a signal called a “mark” is received that record is appended to a CSV file on the disk of the computer hosting KAT.
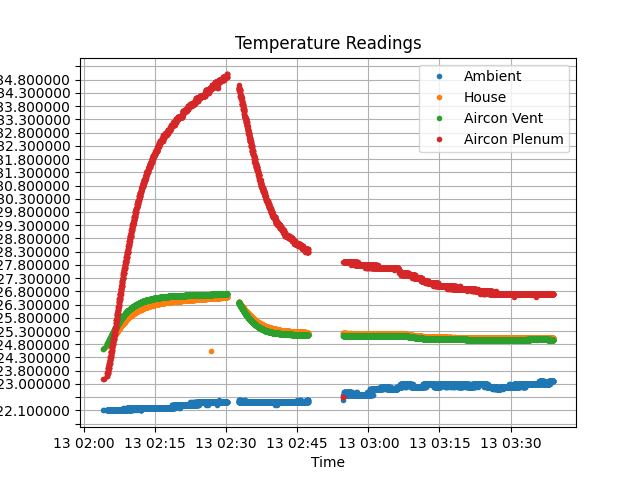
Using this mechanism, we were able to record data from the house and inspect it later. The plot below was obtained from such a recorded CSV using a simple Python + Pandas script:
Eddie commands developed for this application:
K4 code in EDDIE is inherently a “bottom-up” design process. To be more plain, the details of I/O interfacing are designed first, then any mid level functions (that for example convert units used at higher levels). Finally the top level words exist to actually execute the functionality of the system.
The full code can be found at: https://github.com/boredowl-public/Eddie-K451/blob/main/SBRC_Final.k4
We will briefly discuss the final few lines of that code.
The very final line of that code (line 109) creates the data for the graph above:
: acquire begin send4TM 2500 delay false until ;
Executing the word ‘acquire’ causes an infinite loop that runs ‘send4TM’ delays 2.5 seconds and repeats. ‘send4TM’ is defined from line 30:
(* Get and send temperatures *)

variable T

(* ch sendT - given channel ch (0..3) get temperature
  into variable T as an integer in tenths of a degree C.
  Then send T as an integer signal such that ch 0..3 is
  signal 2..5 *)

: sendT dup gettq 1 ftoi T store 2 + 4 T signal 50 delay ;

(* Use sendT for each channel, then send a telemetry
   marker *)
: send4TM 0 sendT 1 sendT 2 sendT 3 sendT mark ;
Put simply, the word ‘sendT’ uses a channel number to get the temperature from a probe channel (0..3), convert it to an integer and send it as a “signal” to the world. The word ‘sendTM’ just does this four all four channels in sequence and then sends a ‘mark’ signal that (as previously discussed) tells the host to record the data.
Prior to running ‘acquire’ we set the conditions in the house using (from the command line):
heating
This word switches the aircon to heat at full power. The fans are turned on automatically by the software when doing this. At around 2:30 in the graph above, we interrupted the ‘acquire’ loop and executed:
cooling
We continued the acquire loop. Some physical adjustments were made at around 2:47 so there is an interruption which is restarted about 5 minutes later. (The slight kink in the graph after that was caused by opening the side door of the model).
You can see from this that “words” executed in K4 take on the substance of commands directly used by the model. The mode on thinking moves from programming to operations.
Lastly, we can present a more elaborate piece of code:
(* To simulate a day (midnight to midnight) as 180 steps at speed milliseconds per step. Uses -cos function to simulate brightness between steps 45 and 135. From steps 105 to 150, the houselights will turn on *)
: d_to_r 0 itof 0.0174533 f* ;: home dup 105 > swap 150 < and houselights ;: daylight 2 d_to_r fcos 0.0 swap f- dup 0.0 f< if drop 0.0 then 100.0 f ;
(* run "daysim" from the console at your leisure *): daysim 180 0 do I home I dup .r daylight lamp speed fetch delay loop ;
(* lights off, a/c off *)
: midnight 0 lamp false houselights 0 airpower fansoff ;
The last word here ‘midnight’ creates a command the turns off the sun lamp, turns off the house lights, reduces aircon power to 0% and turns off the fans.
The word ‘daysim’ executes a loop that divides a day into 180 steps. A little bit of maths using a cos() squared function turns the lamp on between step 45 and 135 (6am to 6pm in real time). This turn on is a smooth transition that looks like sunrise, midday and sunset.
During the 180 step day, the word ‘home’ is run. This simulates our occupants being home between steps 105 and 150 (14:00 hours and 20:00 hours) and turns the interior lights on.
In summary, this is a very brief description of the software we used to make the house model interesting. There is a great deal more that can be done with this. Most certainly we learned a lot building the model and running it with this code. Many new features are being built into K4 for our next examples.